Embed Size (px)
Citation preview
Keeping up with Caltrain Ridership
Adina Levin - Friends of CaltrainJune 2015
Keeping up with Caltrain ridershipUnderlying trends driving ridership growthHow Caltrain can keep up with growthGrade separationsFunding and participation opportunities
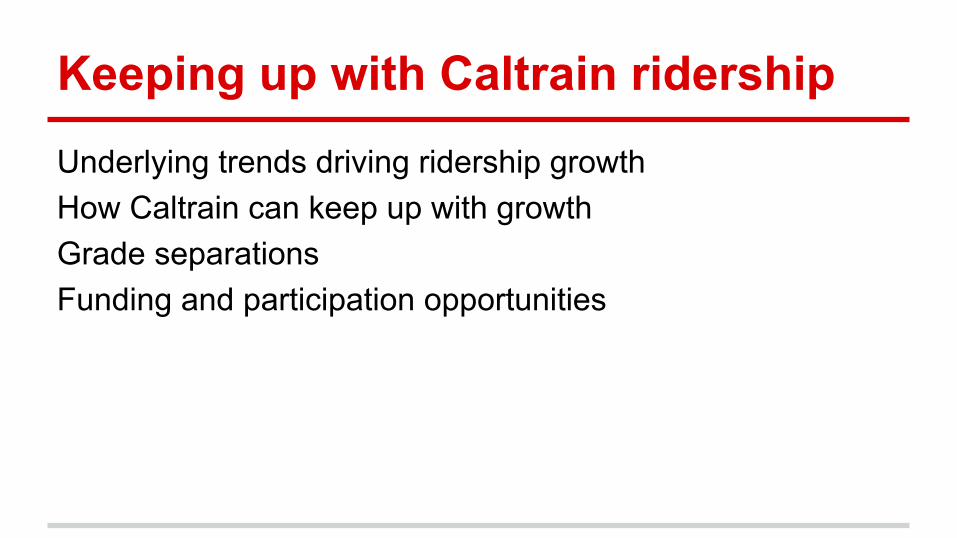
Ridership doubled in last decade
Dot.Com Crash
Baby Bullet
Great Recession
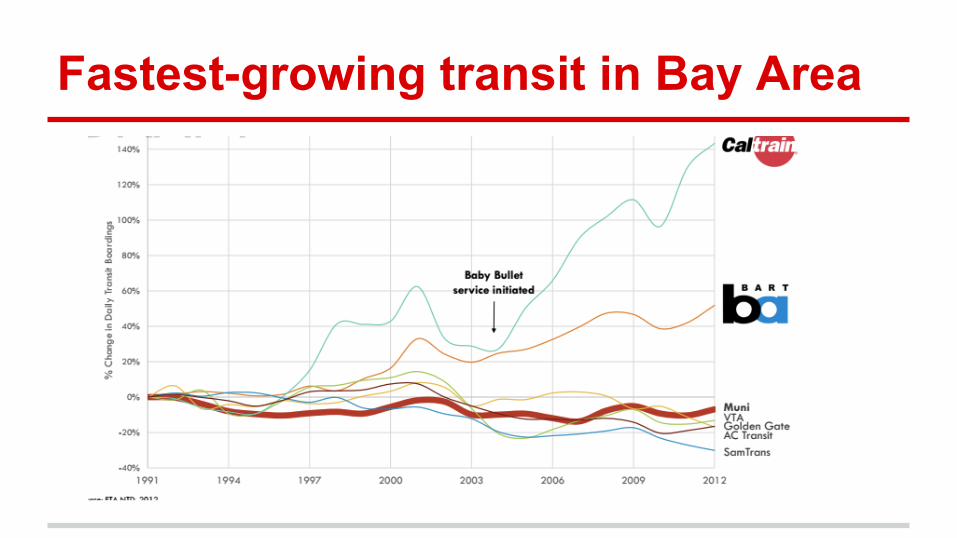
Fastest-growing transit in Bay Area
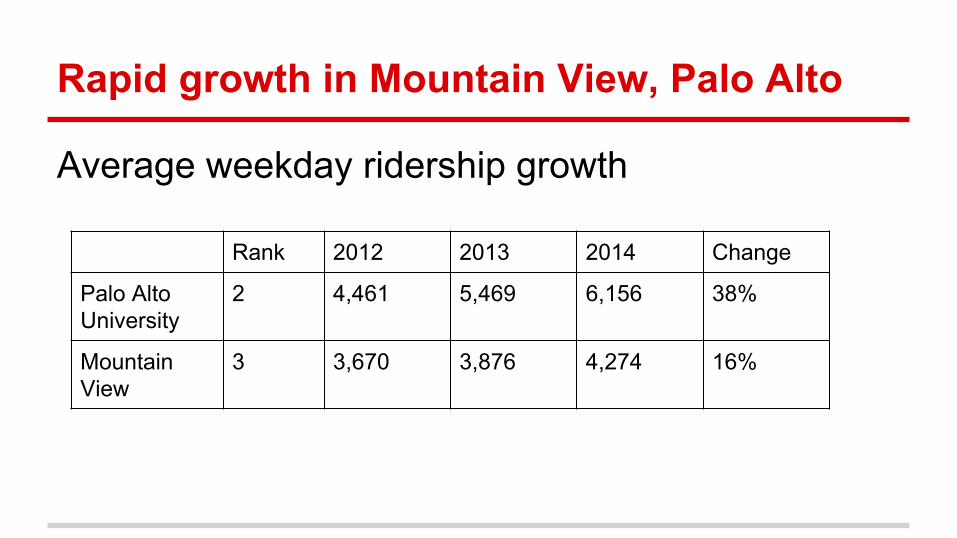
Rapid growth in Mountain View, Palo Alto
Average weekday ridership growth
Rank 2012 2013 2014 Change
Palo Alto University
2 4,461 5,469 6,156 38%
Mountain View
3 3,670 3,876 4,274 16%
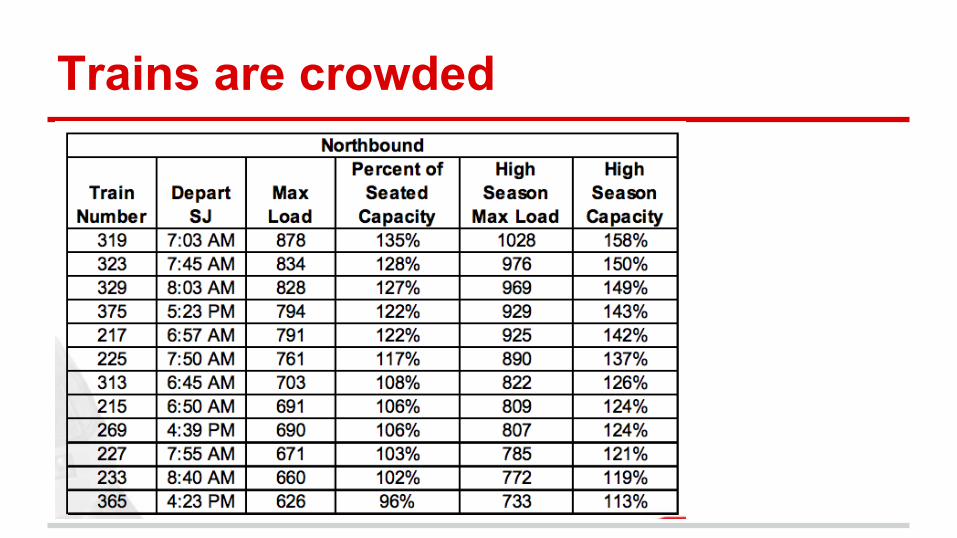
Trains are crowded
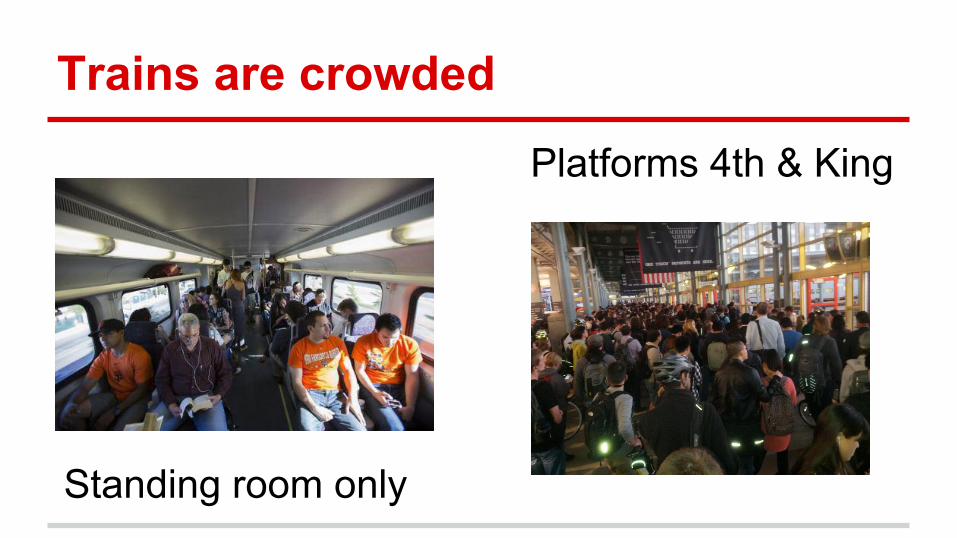
Trains are crowded
Standing room only
Platforms 4th & King
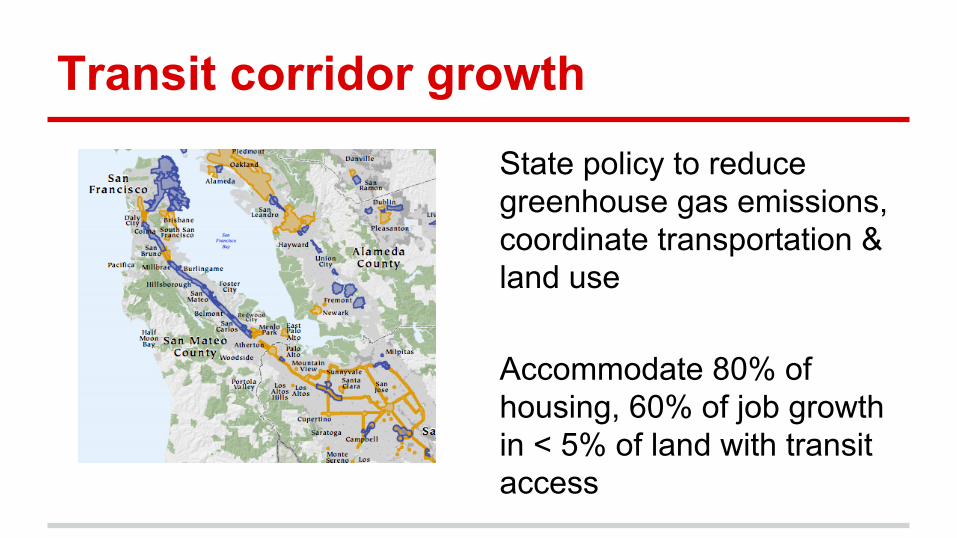
Transit corridor growth
State policy to reduce greenhouse gas emissions, coordinate transportation & land use
Accommodate 80% of housing, 60% of job growth in < 5% of land with transit access
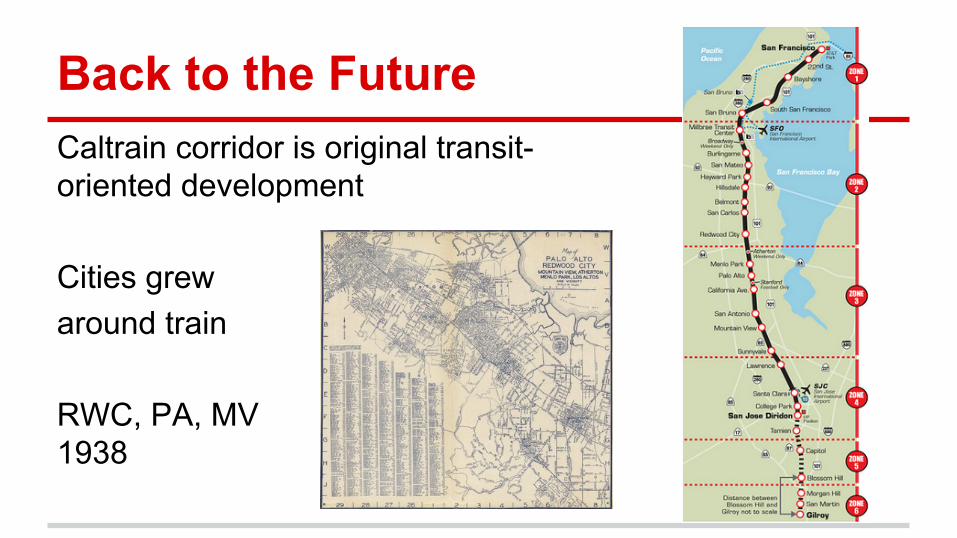
Back to the FutureCaltrain corridor is original transit-oriented development
Cities grew around train
RWC, PA, MV1938
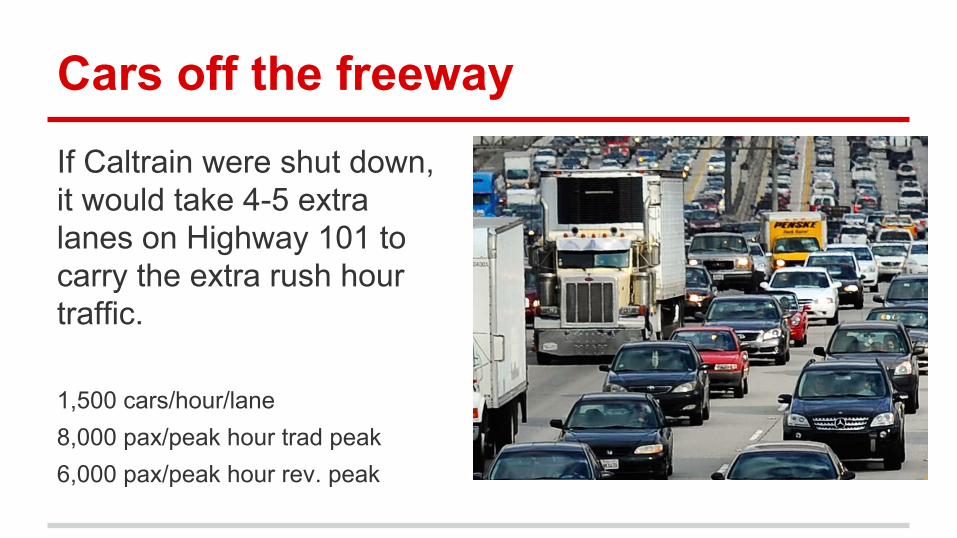
Cars off the freewayIf Caltrain were shut down, it would take 4-5 extra lanes on Highway 101 to carry the extra rush hour traffic.
1,500 cars/hour/lane8,000 pax/peak hour trad peak6,000 pax/peak hour rev. peak
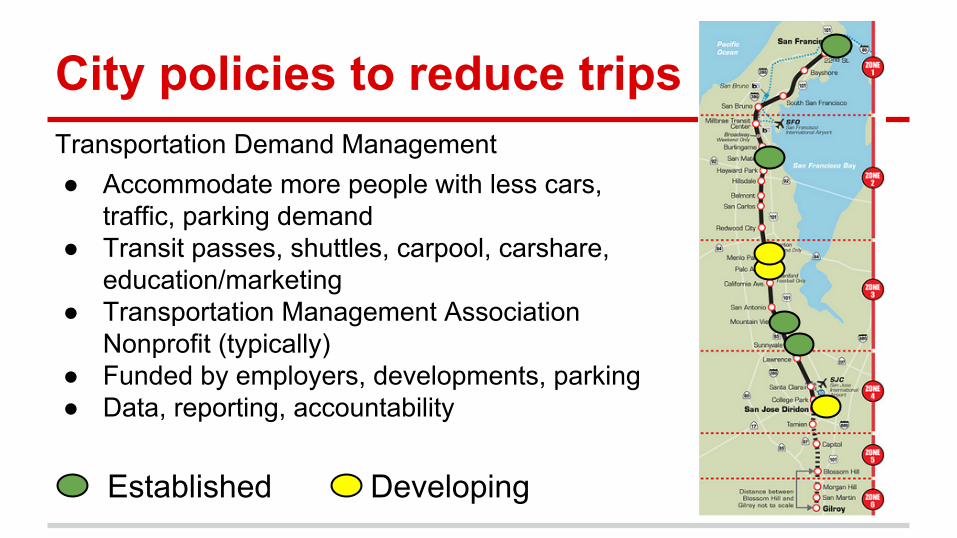
City policies to reduce tripsTransportation Demand Management● Accommodate more people with less cars,
traffic, parking demand● Transit passes, shuttles, carpool, carshare,
education/marketing● Transportation Management Association
Nonprofit (typically)● Funded by employers, developments, parking● Data, reporting, accountability
Established Developing
Goals to reduce drivealone
Mountain View North Bayshore● 45% drivealone (55% today)Downtown Palo Alto● 30% reduction (55% today)
Changing transportation preferencesYounger people driving less…● Average miles driven by 16 to 34 year-olds dropped by
23% between 2001 & 2009● 75% of millennials expect to live in a place where they
do not need a car to get around ● Caltrain rider average income $117,000 (could drive if
they wanted to)● 55% are under 35...
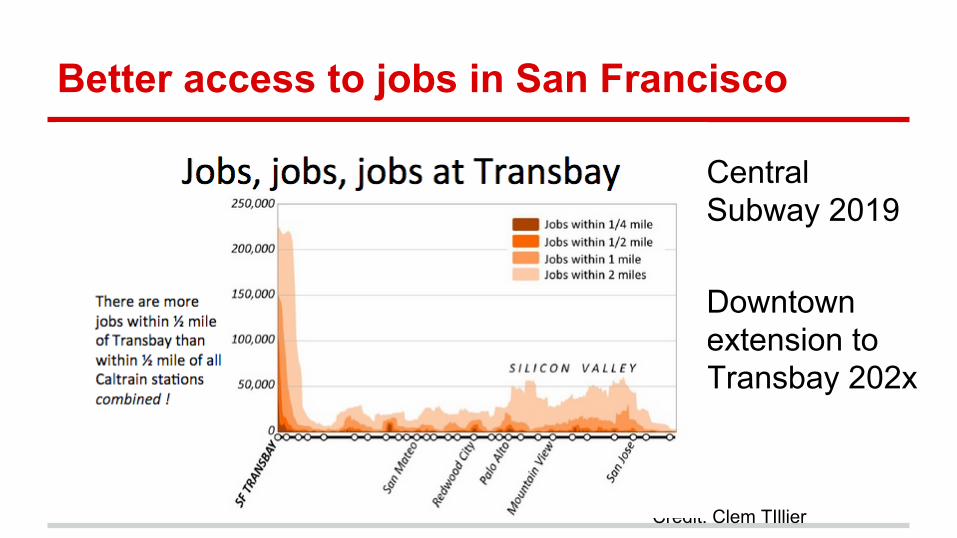
Better access to jobs in San Francisco
Credit: Clem TIllier
Central Subway 2019
Downtown extension to Transbay 202x
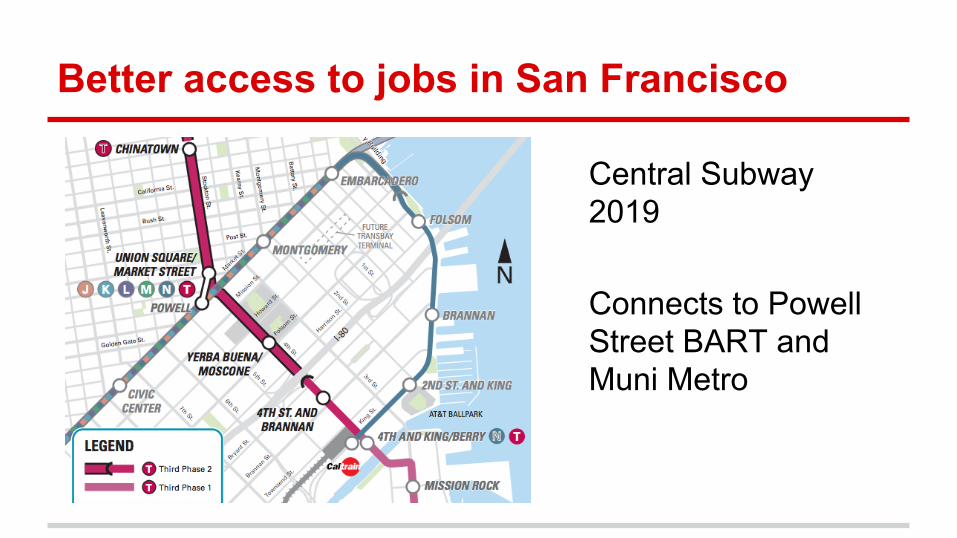
Better access to jobs in San Francisco
Central Subway 2019
Connects to Powell Street BART and Muni Metro
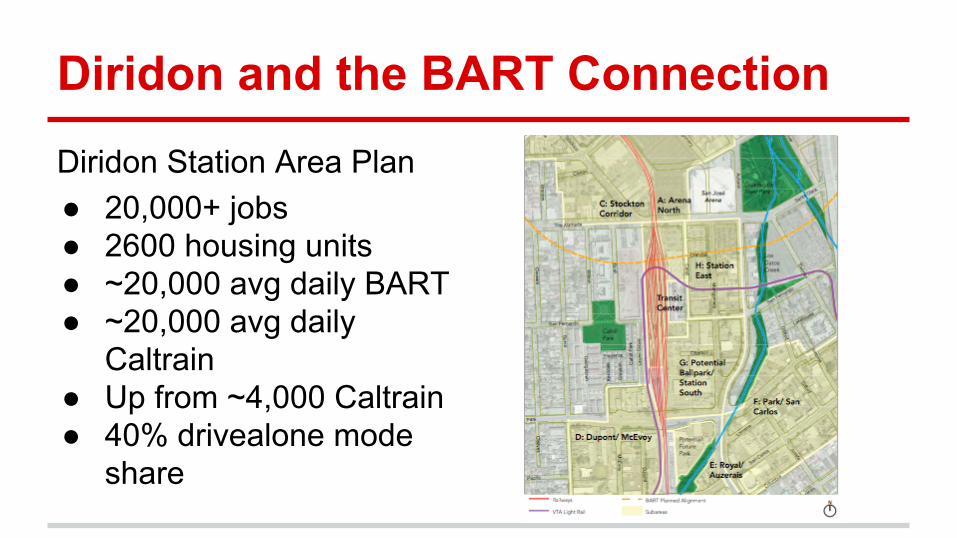
Diridon and the BART ConnectionDiridon Station Area Plan● 20,000+ jobs● 2600 housing units● ~20,000 avg daily BART ● ~20,000 avg daily
Caltrain ● Up from ~4,000 Caltrain● 40% drivealone mode
share
Double ridership in the next decade
“We need to double Caltrain ridership from 60,000 to 120,000 daily trips by the next
decade”
Carl Guardino, Silicon Valley Leadership Group
Peak hour capacity
How many people can travel at peak hour# train cars# people per car (seated, standing, bikes)# trains per hourEven distribution (are some cars less full)
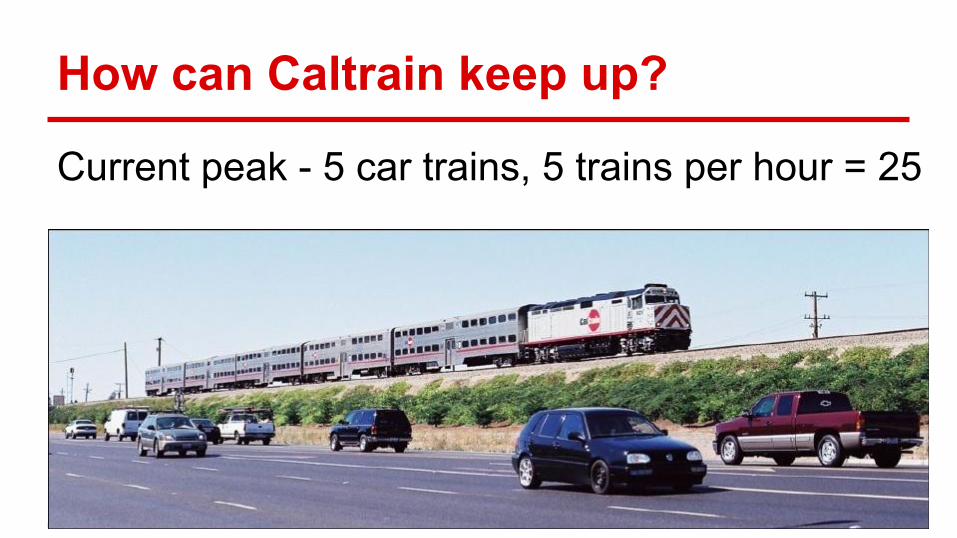
How can Caltrain keep up?
Current peak - 5 car trains, 5 trains per hour = 25
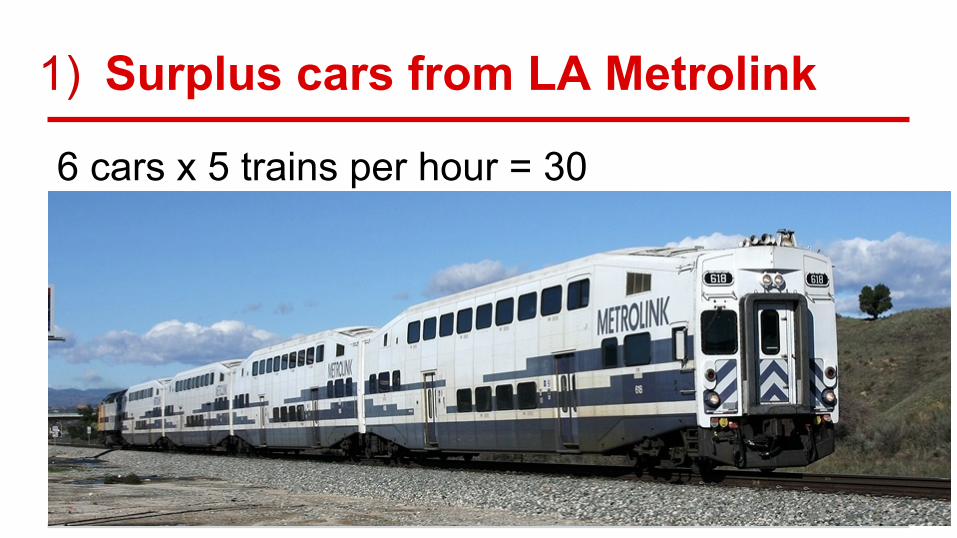
1) Surplus cars from LA Metrolink
6 cars x 5 trains per hour = 30
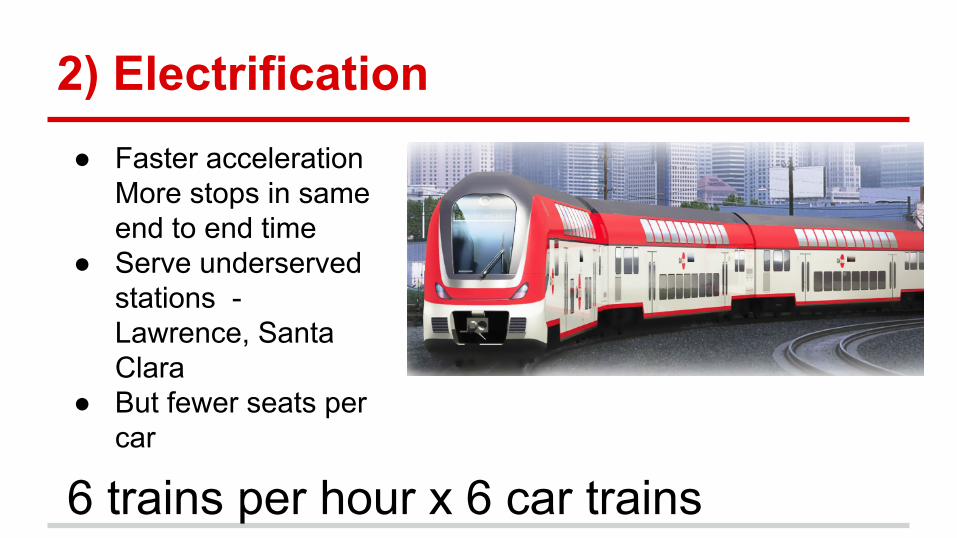
2) Electrification● Faster acceleration
More stops in same end to end time
● Serve underserved stations - Lawrence, Santa Clara
● But fewer seats per car
6 trains per hour x 6 car trains

3) Longer platforms, level boarding8-car trains
Level boarding● faster service● better for mobility-impaired, strollers,
bikes● more reliable
6 trains/hour x 8 cars = 48

4) Increase frequencyBlended system: Caltrain & HSR share tracksUp to 2 HSR trains per hour without passing tracks Up to 4 HSR trains per hour with passing tracksDon’t need to wait for HSR
8 trains per hour x 8 car trains = 64
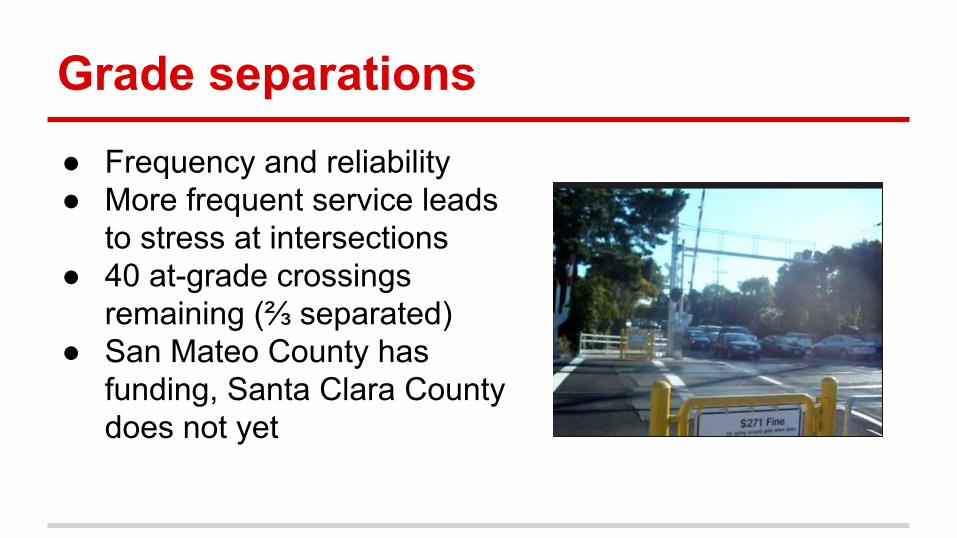
Grade separations● Frequency and reliability● More frequent service leads
to stress at intersections● 40 at-grade crossings
remaining (⅔ separated)● San Mateo County has
funding, Santa Clara County does not yet
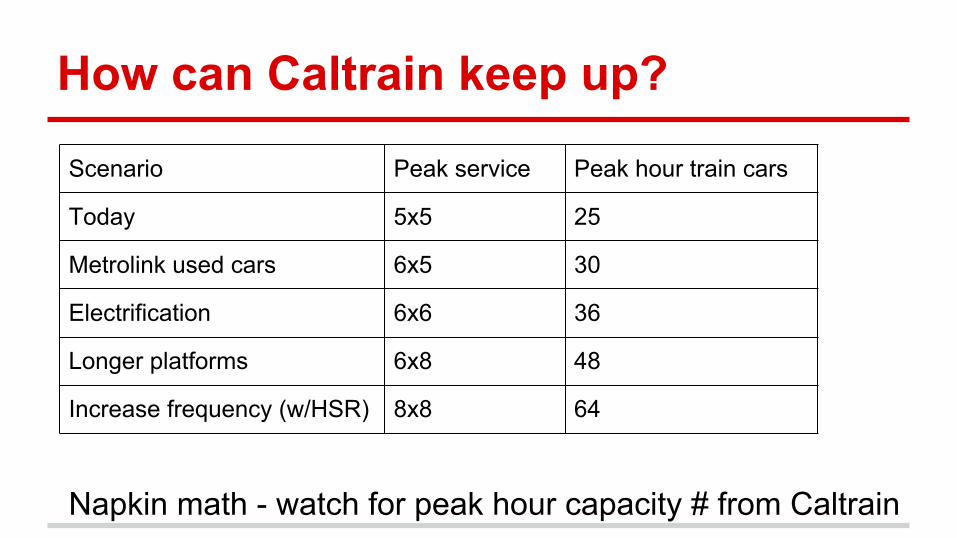
How can Caltrain keep up?
Scenario Peak service Peak hour train cars
Today 5x5 25
Metrolink used cars 6x5 30
Electrification 6x6 36
Longer platforms 6x8 48
Increase frequency (w/HSR) 8x8 64
Napkin math - watch for peak hour capacity # from Caltrain
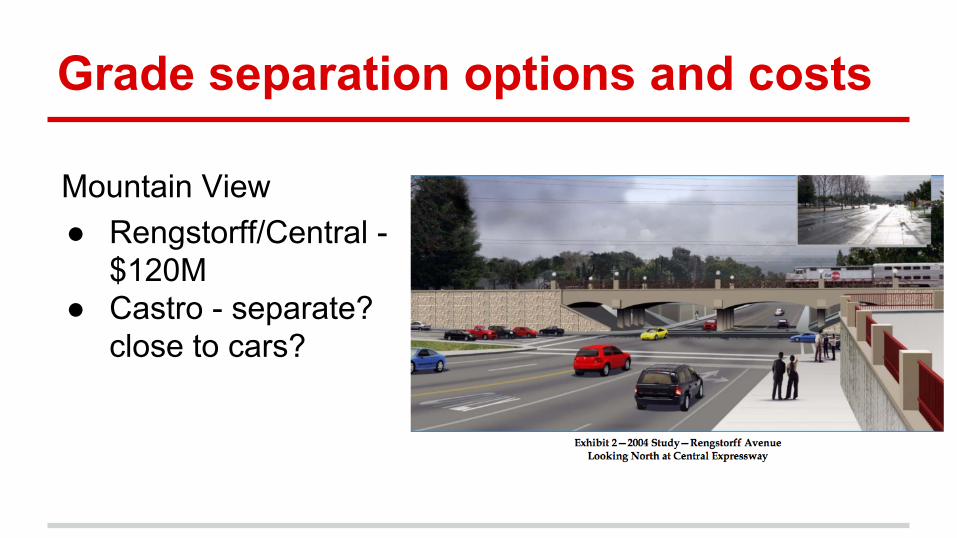
Grade separation options and costs
Mountain View● Rengstorff/Central -
$120M● Castro - separate?
close to cars?

Grade separation options and costs
Palo Alto● Charleston, Meadow,
Churchill● Trench - $500M to $1B● Development funds?
Local tax?
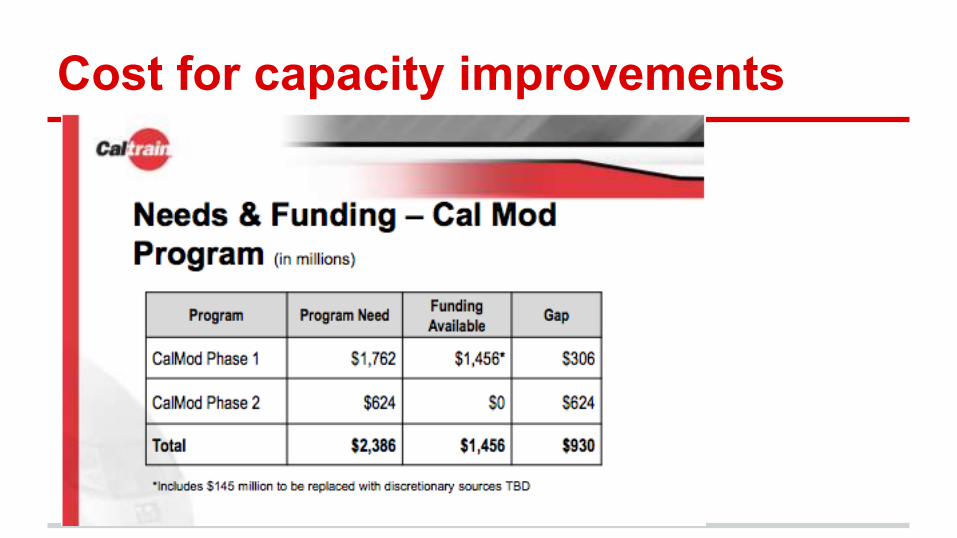
Cost for capacity improvements
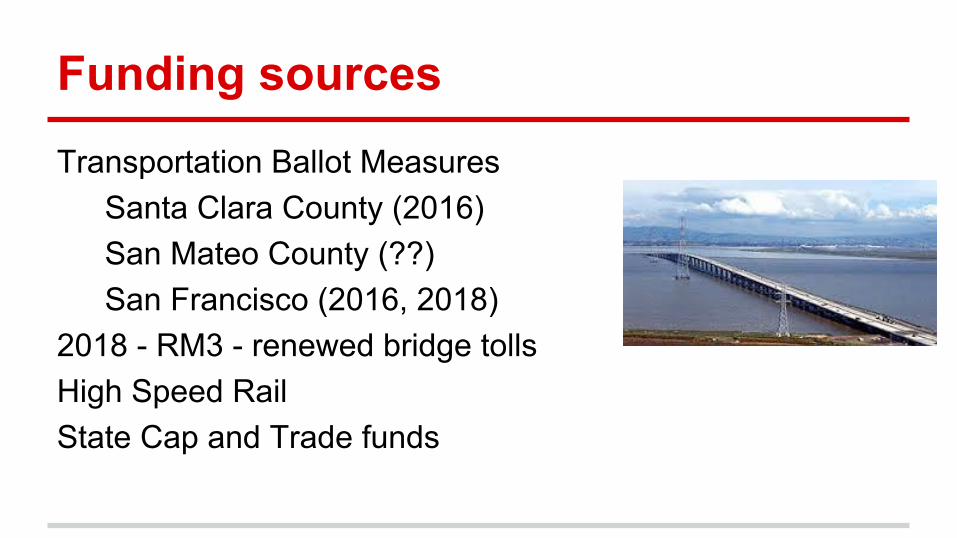
Funding sourcesTransportation Ballot Measures
Santa Clara County (2016)San Mateo County (??)San Francisco (2016, 2018)
2018 - RM3 - renewed bridge tollsHigh Speed RailState Cap and Trade funds
Santa Clara County Ballot Measure2016 - Envision Silicon Valley$3.5 Billion or $7 Billion
BART to Diridon (and Santa Clara?)CaltrainExpressways/FreewaysRoad paving
Upcoming decisions1) Santa Clara County VTA Call for Projects2) Transit Center / grade separation planning3) Planning with High Speed Rail